Site Characterisation

EOMORES offers analysis of historical and current data in order to assess water body characteristics such as susceptibility to algal blooms and river discharge, and to enhance monitoring capabilities in terms of typical cloud coverage and others.
What is the problem?
Long-term monitoring of ecosystem health indicators is non-existent for the vast majority of the world’s more than 100 million water bodies. Even when regular sampling is carried out, the daily and seasonal variation is not always taken into consideration. Conclusions are often drawn based on an insufficiently small number of samples.
Remote sensing via satellites offers the potential to integrate a limited set of ecosystem health indicators into long-term observation records. A thorough characterisation of individual waterbodies or coastal regions lays the basis for developing more effective standard monitoring practices. Episodic events, which might otherwise be missed by traditional sampling, can thereby be systematically anticipated, and their impact monitored.
How do EOMORES address it?
- EOMORES can provide analysis of archived and current Earth observation data to provide water quality products and statistics aggregated by year, season or by day. These data can be used to inform conventional monitoring practises (e.g. the selection of sampling sites) and reduce uncertainties in water quality estimates arising from sparse sampling strategies.
- EOMORES provides regional or water-body specific charts and maps tailored to the user’s needs, illustrating the effects of episodic events on water quality.
- EOMORES also offers a service for collection of in situ measurements. These are essential for satellite data validation and product calibration, in order to assure continuous observations under cloud cover (in accessible regions).
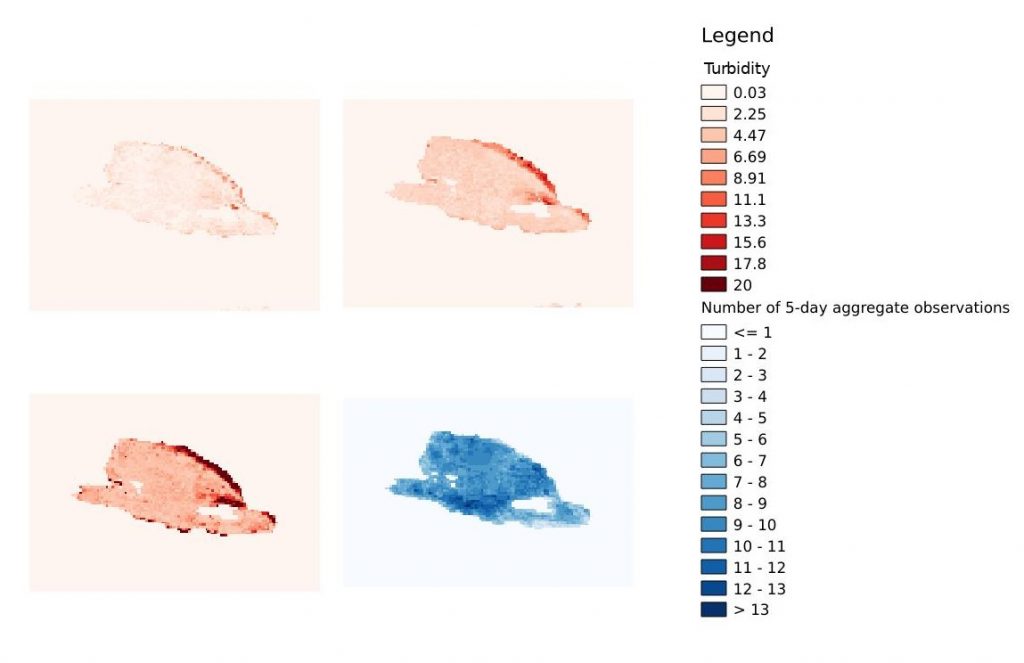
EOMORES in action: characterisation of turbidity in Loch Leven, UK, for 2018
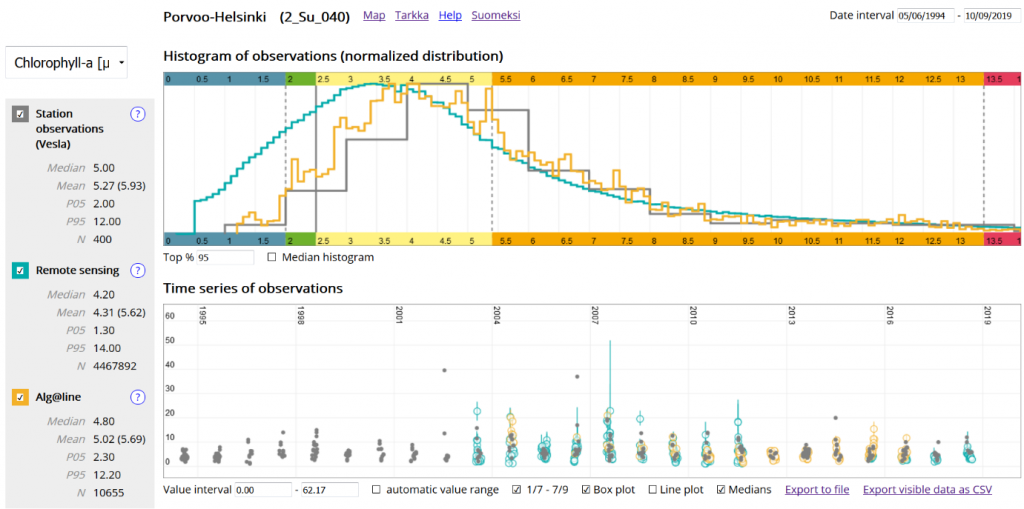
EOMORES in action: Aggregated data for reporting as per the Water Framework Directive in 2018 for a location near Poorvoo, Finland