Algae

What is the problem?
Lakes are an important source of surface water whilst also catering to a variety of ecosystems. Due to human impact and climate change, water quality is on the decline resulting in, amongst other things, excessive algae growth and increased concentrations of cyanobacteria.
How do the EOMORES address it?
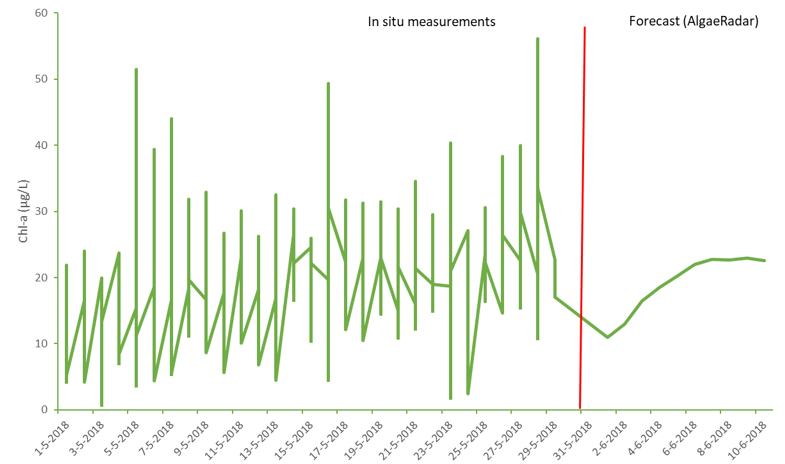
EOMORES services provide highly accurate, spatial and timely information as a result of combining satellite mapping, high-frequency in situ measurements and forecasting models of chlorophyll-a (chl-a) and phycocyanin concentrations, and algal blooms.
Critical phenomena (algal blooms) can be identified, and their evolution over time can be tracked. This information can then be used by local authorities to, for instance, plan sampling activities or issue advisory notices regarding swimming areas.
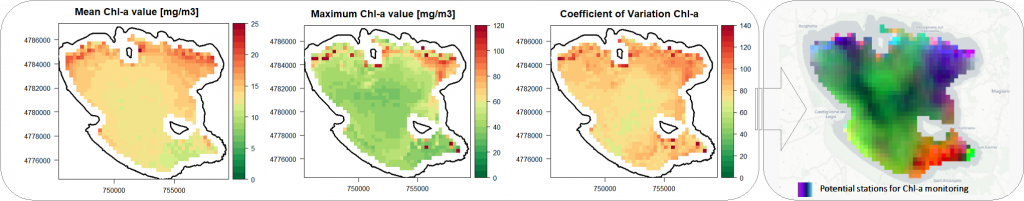
EOMORES in action: Identifying locations sensitive to phytoplankton dynamics in order to optimise chl-a sampling in Lake Trasimeno (Italy)
EOMORES combines chl-a maps to pinpoint the most appropriate locations for sampling, taking into consideration the specific geography and particularities of the water body. An example of such maps, based on satellite observations of one of Italy’s biggest lakes during 2017, is presented in the figure below. The data in the first three maps seems to demonstrate rather homogenous patterns of chl-a, with somewhat higher values in the north and lower in the south-east. Combining the maps results in a synthetic representation (far right) which can be valuable when developing a sampling plan, so that stations are located in areas which are more sensitive to phytoplankton dynamics. The areas in purple are those which should be targeted by in situ monitoring. In the orange/red areas to the south-east, variation is due to suspended particulate matter, whereas in the green areas, variation occurs due to changes in all water quality parameters. Overall these two areas are less sensitive to Chl-a variation.